Visualization functions
Visualization functions render numeric data as compact Unicode block charts
directly in query results. The output is a varchar cell that works everywhere:
psql, the web console, JDBC clients, or CSV exports.
| Function | Type | Description |
|---|---|---|
| bar | Scalar | Horizontal bar proportional to a value within a range |
| depth_chart | Scalar | Market depth profile from bid/ask volume arrays |
| depth_chart_labels | Scalar | Market depth profile with volume statistics |
| ohlc_bar | Aggregate or Scalar | OHLC candlestick bar from price data or precomputed values |
| ohlc_bar_labels | Aggregate or Scalar | OHLC candlestick bar with labeled values |
| sparkline | Aggregate | Vertical block chart of values within a group |
Resolution and rendering
Visualization functions render data as Unicode text characters, for example
⠀⠀───░░░░──⠀⠀ (OHLC candle) or ▃▅▇▆▄▂▁▃▅▇ (sparkline). Each character
position represents a range of values, not a single precise point. A bar
rendered at width 40 can only distinguish 40 distinct levels across its scale
range. Values that fall within the same character-width bucket are
indistinguishable in the output.
These functions are designed for quick visual inspection of trends, relative magnitudes, and data structure directly in query results. They are not a replacement for pixel-level charting tools.
bar
bar(value, min, max, width) renders a single numeric value as a horizontal
bar (████████████▌), made of full block characters with a fractional block
at the end for sub-character precision.
Parameters
All four arguments are required:
valueis any numeric value. Implicitly cast todouble.NULLproducesNULLoutput.min(double): the value that maps to an empty bar (zero length).max(double): the value that maps to a full bar (widthcharacters).width(int): the number of characters atmaxvalue.
Values below min are clamped to an empty bar. Values above max are clamped
to a full bar of width characters. If min, max, or width are NULL, or
if min >= max, the function returns NULL.
Return value
Return value type is varchar.
SELECT symbol, round(price, 4) price,
       bar(price, 0.5, 1.5, 25)
FROM fx_trades
WHERE symbol IN ('EURUSD', 'GBPUSD',
  'USDCHF', 'USDCAD', 'AUDUSD')
LATEST ON timestamp PARTITION BY symbol;
 symbol | price  | bar
--------+--------+------------------------
 AUDUSD | 0.7128 | █████▎
 USDCAD | 1.3708 | █████████████████████▊
 USDCHF | 0.7836 | ███████
 EURUSD | 1.1618 | ████████████████▌
 GBPUSD | 1.3417 | █████████████████████
Visual encoding
█▉▊▋▌▍▎▏
A full block fills the character cell; fractional blocks at the end provide
sub-character precision. A width of 20 characters gives 160 discrete levels
of resolution (20 x 8).
Since bar is a scalar function, it can wrap aggregates like sum(), avg(),
or count() to visualize their results inline.
The web console can
rotate bar output to a vertical chart when the
query returns exactly two columns (timestamp + bar).
Examples
SELECT timestamp, symbol,
       round(sum(amount), 2) total,
       bar(sum(amount), 0, 50, 30)
FROM trades
WHERE symbol IN ('BTC-USDT', 'ETH-USDT')
  AND timestamp IN '$today'
SAMPLE BY 1m
LIMIT -5;
 timestamp                   | symbol   | total  | bar
-----------------------------+----------+--------+--------------------------------
 2026-04-29T15:41:00.000000Z | BTC-USDT |   5.89 | ███▌
 2026-04-29T15:42:00.000000Z | ETH-USDT | 119.54 | ██████████████████████████████
 2026-04-29T15:42:00.000000Z | BTC-USDT |   3.53 | ██
 2026-04-29T15:43:00.000000Z | ETH-USDT |  41.15 | ████████████████████████▋
 2026-04-29T15:43:00.000000Z | BTC-USDT |   1.6  | ▉
SELECT timestamp, symbol, round(total, 2) total,
       bar(total, min(total) OVER (PARTITION BY symbol),
                  max(total) OVER (PARTITION BY symbol), 30)
FROM (
  SELECT timestamp, symbol, sum(amount) total
  FROM trades
  WHERE symbol IN ('BTC-USDT', 'ETH-USDT')
    AND timestamp IN '$today'
  SAMPLE BY 1m
)
LIMIT -5;
 timestamp                   | symbol   | total  | bar
-----------------------------+----------+--------+------
 2026-04-29T15:41:00.000000Z | ETH-USDT |  44.7  | █▍
 2026-04-29T15:42:00.000000Z | BTC-USDT |   3.53 | █▏
 2026-04-29T15:42:00.000000Z | ETH-USDT | 119.54 | ███▋
 2026-04-29T15:43:00.000000Z | BTC-USDT |   1.6  | ▌
 2026-04-29T15:43:00.000000Z | ETH-USDT |  41.15 | █▎
Each symbol's bars scale independently because PARTITION BY symbol gives each
its own min/max range.
SELECT timestamp, symbol, round(total, 2) total,
       bar(total, min(total) OVER (),
                  max(total) OVER (), 30)
FROM (
  SELECT timestamp, symbol, sum(amount) total
  FROM trades
  WHERE symbol IN ('BTC-USDT', 'ETH-USDT')
    AND timestamp IN '$today'
  SAMPLE BY 1m
)
LIMIT -5;
 timestamp                   | symbol   | total  | bar
-----------------------------+----------+--------+-----
 2026-04-29T15:41:00.000000Z | ETH-USDT |  44.7  | █▍
 2026-04-29T15:42:00.000000Z | BTC-USDT |   3.53 |
 2026-04-29T15:42:00.000000Z | ETH-USDT | 119.54 | ███▋
 2026-04-29T15:43:00.000000Z | BTC-USDT |   1.6  |
 2026-04-29T15:43:00.000000Z | ETH-USDT |  41.15 | █▎
All symbols share the same min/max, making bars comparable across groups.
See also
- sparkline - Aggregate trend chart
- Web console features - rotation to vertical chart
depth_chart
depth_chart(bid_volumes[], ask_volumes[] [, width]) renders a market depth
profile (█▇▆▅▄▃▂▁╎▁▂▃▄▅▆▇█) from bid and ask volume arrays. Bids appear on
the left (tallest at the edges representing deepest liquidity), asks on the
right, with a spread marker (╎) in the center.
See also depth_chart_labels, which appends volume statistics after the chart.
Parameters
bid_volumes(DOUBLE[]): per-level bid volumes, ordered best-to-worst.ask_volumes(DOUBLE[]): per-level ask volumes, ordered best-to-worst.width(optional,int): total chart width in characters. Default: array lengths + 1. Minimum: 3.
Arrays must be one-dimensional. They can have different lengths (asymmetric books are valid).
Return value
Return value type is varchar.
SELECT timestamp, symbol,
       depth_chart(bids[2], asks[2])
FROM market_data
WHERE timestamp IN '$today'
  AND symbol IN ('EURUSD', 'GBPUSD',
    'USDJPY', 'USDCAD', 'USDCHF')
LATEST ON timestamp PARTITION BY symbol;
 timestamp                   | symbol | depth_chart
-----------------------------+--------+-----------------------------------------------------------------------
 2026-04-29T13:18:09.646733Z | EURUSD | █▇▇▇▇▇▆▆▆▆▆▆▅▅▅▅▅▅▄▄▄▄▄▄▃▃▃▃▃▂▂▂▁▁╎▁▁▂▂▂▃▃▃▃▃▄▄▄▄▄▄▅▅▅▅▅▅▆▆▆▆▆▇▇▇▇▇▇▇
 2026-04-29T13:18:09.783631Z | GBPUSD | █▇▇▇▆▆▆▆▅▅▅▄▄▄▃▃▂▂▁╎▁▂▃▃▃▄▄▄▅▅▅▆▆▆▆▇▇▇▇
 2026-04-29T13:18:10.044379Z | USDCHF | ▇▇▇▇▇▆▆▆▆▆▅▅▅▅▅▄▄▄▄▃▃▃▃▂▂▁▁╎▁▁▂▂▃▃▃▃▄▄▄▄▅▅▅▅▅▆▆▆▆▆▇▇▇▇█
 2026-04-29T13:18:10.106524Z | USDCAD | ▇▇▇▇▆▆▆▆▅▅▅▅▄▄▄▃▃▃▂▁▁╎▁▂▂▃▃▃▄▄▄▅▅▅▅▆▆▆▇▇▇▇█
 2026-04-29T13:18:10.159159Z | USDJPY | ▇▆▄▁╎▁▄▆█
Each symbol has a different number of depth levels. The chart width adjusts
automatically. Symmetric shapes indicate balanced books, and one side taller
than the other indicates a liquidity imbalance. Use the optional width
parameter to force all charts to the same number of characters for side-by-side
comparison.
Visual encoding
| Purpose | Character |
|---|---|
| Depth levels | █▇▆▅▄▃▂▁▁▂▃▄▅▆▇█ |
| Spread marker | ╎ |
The function computes cumulative sums from each array, then applies log1p() to
compress the dynamic range. This is necessary because cumulative depth grows
exponentially. Without log scale, only the deepest levels would be visible and
all near-spread levels would appear as the lowest character.
The web console colorizes bid and ask sides in green and red.
Width behavior
- Default: one character per array element plus the spread marker. A 30-level book on each side produces a 61-character chart.
- Explicit width: the cumulative curve is subsampled if the width is smaller
than the arrays. If the width is larger, remaining positions are padded with
▁on the far sides (bids pad on the left, asks pad on the right), keeping real data adjacent to the spread.
NULL handling
- NULL or empty arrays return NULL
- Non-finite elements (NaN, Infinity) throw an error
- Negative volumes throw an error
- Zero volumes are valid and render as
▁
Examples
SELECT symbol,
       depth_chart(bids[2], asks[2], 21)
FROM market_data
WHERE timestamp IN '$today'
  AND symbol IN ('EURUSD', 'GBPUSD',
    'USDJPY')
LATEST ON timestamp PARTITION BY symbol;
 symbol | depth_chart
--------+------------------------
 EURUSD | █▇▆▅▅▄▃▃▂▁╎▁▂▃▃▄▅▅▆▇▇
 GBPUSD | █▇▆▆▅▅▄▃▂▁╎▁▂▃▄▅▅▆▆▇▇
 USDJPY | ▁▁▁▁▁▁▇▇▇▆╎▆▇▇█▁▁▁▁▁▁
At a fixed width, books with different numbers of levels are directly comparable. The shape reveals structural differences: USDJPY shows an unusual profile with thin liquidity near the spread and heavy volume at the edges.
See also
- depth_chart_labels - same chart with volume statistics
- sparkline - for time-series trends rather than point-in-time depth
- Web console features - colorizing of bid/ask sides
depth_chart_labels
depth_chart_labels(bid_volumes[], ask_volumes[] [, width]) is identical to
depth_chart but appends volume statistics after the chart:
bb:<best_bid_vol> ba:<best_ask_vol> tb:<total_bid_vol> ta:<total_ask_vol>.
Labels show:
bb- best bid volume (first element of bid array)ba- best ask volume (first element of ask array)tb- total bid volume (sum of all bid levels)ta- total ask volume (sum of all ask levels)
See depth_chart for parameters, scaling behavior, and additional examples.
Examples
SELECT timestamp, symbol,
       depth_chart_labels(bids[2], asks[2])
FROM market_data
WHERE timestamp IN '$today'
  AND symbol IN ('EURUSD', 'GBPUSD')
LATEST ON timestamp PARTITION BY symbol;
 timestamp                   | symbol | depth_chart_labels
-----------------------------+--------+----------------------------------------------------------------------------------------------------------------------
 2026-04-29T13:18:09.646733Z | EURUSD | █▇▇▇▇▇▆▆▆▆▆▆▅▅▅▅▅▅▄▄▄▄▄▄▃▃▃▃▃▂▂▂▁▁╎▁▁▂▂▂▃▃▃▃▃▄▄▄▄▄▄▅▅▅▅▅▅▆▆▆▆▆▇▇▇▇▇▇▇ bb:55076.0 ba:79588.0 tb:1.044909019E9 ta:1.033808641E9
 2026-04-29T13:18:09.783631Z | GBPUSD | █▇▇▇▆▆▆▆▅▅▅▄▄▄▃▃▂▂▁╎▁▂▃▃▃▄▄▄▅▅▅▆▆▆▆▇▇▇▇ bb:53119.0 ba:92211.0 tb:2.9577178E7 ta:2.9154932E7
See also
- depth_chart - same chart without labels
- Web console features - colorizing of bid/ask sides
ohlc_bar
Renders OHLC (Open, High, Low, Close) candlestick data as horizontal Unicode
bars (⠀⠀───░░░░░──⠀⠀). Each row produces a text candlestick showing wick
(high-low range) and body (open-close range), directly in query results.
See also ohlc_bar_labels, which appends OHLC values after the bar.
Aggregate variant
ohlc_bar(price, min, max [, width]) is a GROUP BY / SAMPLE BY aggregate.
Computes Open (first value by row order), High (max), Low (min), and Close (last
value by row order) from raw price observations within each group. Renders using
the supplied min/max bounds for scaling.
When to use: raw tick or trade data where you want OHLC candles computed and rendered in one step with SAMPLE BY.
Parameters
price(double): value column to aggregate into OHLC.min(double): lower bound for scaling (left edge of bar).max(double): upper bound for scaling (right edge of bar).width(optional,int): bar width in characters, default 40.
The min and max parameters accept column references, lateral join results, constants, and bind variables.
Return value
Return value type is varchar.
SELECT timestamp,
       ohlc_bar(price, 1.15, 1.19, 40)
FROM fx_trades
WHERE symbol = 'EURUSD'
  AND timestamp IN '$today'
SAMPLE BY 30m
LIMIT -5;
 timestamp                      | ohlc_bar
--------------------------------+------------------------------------------
 2026-04-29T11:00:00.000000000Z | ⠀⠀⠀⠀⠀⠀⠀⠀⠀─░░░░░░░░░░░░───────────⠀⠀⠀⠀⠀⠀⠀
 2026-04-29T11:30:00.000000000Z | ⠀⠀⠀⠀⠀⠀⠀⠀──██─────────────────────⠀⠀⠀⠀⠀⠀⠀
 2026-04-29T12:00:00.000000000Z | ⠀⠀⠀⠀⠀⠀⠀⠀⠀⠀⠀─███████████████───────⠀⠀⠀⠀⠀⠀
 2026-04-29T12:30:00.000000000Z | ⠀⠀⠀⠀⠀⠀⠀─────░░░░░░░░░░░░░░░░░⠀⠀⠀⠀⠀⠀⠀⠀⠀⠀⠀
 2026-04-29T13:00:00.000000000Z | ⠀⠀⠀⠀⠀⠀⠀────██─────⠀⠀⠀⠀⠀⠀⠀⠀⠀⠀⠀⠀⠀⠀⠀⠀⠀⠀⠀⠀⠀⠀
Visual encoding
⠀⠀⠀───██████─────⠀⠀⠀  Bullish (close >= open): █ body, ─ wick
⠀⠀───────░░░░──⠀⠀⠀⠀  Bearish (close < open):  ░ body, ─ wick
⠀⠀⠀⠀──│──⠀⠀⠀⠀⠀⠀⠀⠀  Doji (close == open):    │ line, ─ wick
All candles in a result set are scaled against the same min/max bounds, so their horizontal positions are directly comparable across rows.
The web console colorizes bullish bodies green and bearish bodies red, and can rotate the output to the traditional vertical candlestick chart.
Bounds
Both variants require explicit min and max bounds for scaling. These bounds define what price maps to the left edge (position 0) and what price maps to the right edge (position width-1).
The bounds are not auto-computed from the data. This is deliberate: auto-computing global bounds inside an aggregate function would be non-deterministic in QuestDB's parallel execution engine.
Common patterns for supplying bounds:
- Constants for known price ranges
- DECLARE variables for parameterized queries
- CROSS JOIN subquery for single-symbol dynamic bounds
- LATERAL JOIN for per-symbol bounds in multi-symbol queries
FILL support
The aggregate variant supports FILL(NULL), FILL(PREV), and FILL(NONE).
FILL(LINEAR) is not supported (interpolating OHLC is undefined).
Examples
DECLARE @lo := 1.15, @hi := 1.19

SELECT timestamp,
       ohlc_bar(price, @lo, @hi, 40)
FROM fx_trades
WHERE symbol = 'EURUSD'
  AND timestamp IN '$today'
SAMPLE BY 30m
LIMIT -5;
 timestamp                      | ohlc_bar
--------------------------------+------------------------------------------
 2026-04-29T11:00:00.000000000Z | ⠀⠀⠀⠀⠀⠀⠀⠀⠀─░░░░░░░░░░░░───────────⠀⠀⠀⠀⠀⠀⠀
 2026-04-29T11:30:00.000000000Z | ⠀⠀⠀⠀⠀⠀⠀⠀──██─────────────────────⠀⠀⠀⠀⠀⠀⠀
 2026-04-29T12:00:00.000000000Z | ⠀⠀⠀⠀⠀⠀⠀⠀⠀⠀⠀─███████████████───────⠀⠀⠀⠀⠀⠀
 2026-04-29T12:30:00.000000000Z | ⠀⠀⠀⠀⠀⠀⠀─────░░░░░░░░░░░░░░░░░⠀⠀⠀⠀⠀⠀⠀⠀⠀⠀⠀
 2026-04-29T13:00:00.000000000Z | ⠀⠀⠀⠀⠀⠀⠀────██─────⠀⠀⠀⠀⠀⠀⠀⠀⠀⠀⠀⠀⠀⠀⠀⠀⠀⠀⠀⠀⠀⠀
SELECT timestamp,
       ohlc_bar(price, lo, hi, 50)
FROM fx_trades
CROSS JOIN (
  SELECT min(price) lo, max(price) hi
  FROM fx_trades
  WHERE symbol = 'EURUSD'
    AND timestamp IN '$today'
)
WHERE symbol = 'EURUSD'
  AND timestamp IN '$today'
SAMPLE BY 30m
LIMIT -5;
 timestamp                      | ohlc_bar
--------------------------------+----------------------------------------------------
 2026-04-29T11:00:00.000000000Z | ⠀⠀⠀──░░░░░░░░░░░░░░░░░░░░░░──────────────────────⠀
 2026-04-29T11:30:00.000000000Z | ⠀⠀────███─────────────────────────────────────────
 2026-04-29T12:00:00.000000000Z | ⠀⠀⠀⠀⠀⠀⠀──█████████████████████████████────────────
 2026-04-29T12:30:00.000000000Z | ────────░░░░░░░░░░░░░░░░░░░░░░░░░░░░░░░░░⠀⠀⠀⠀⠀⠀⠀⠀⠀
 2026-04-29T13:00:00.000000000Z | ────────│──────────⠀⠀⠀⠀⠀⠀⠀⠀⠀⠀⠀⠀⠀⠀⠀⠀⠀⠀⠀⠀⠀⠀⠀⠀⠀⠀⠀⠀⠀⠀⠀
SELECT timestamp, symbol,
       ohlc_bar(price, lo, hi, 40)
FROM fx_trades t
JOIN LATERAL (
  SELECT min(price) lo, max(price) hi
  FROM fx_trades t2
  WHERE t.symbol = t2.symbol
    AND t2.timestamp IN '$today'
)
WHERE symbol IN ('EURUSD', 'GBPUSD')
  AND timestamp IN '$today'
SAMPLE BY 30m
LIMIT -5;
 timestamp                      | symbol | ohlc_bar
--------------------------------+--------+------------------------------------------
 2026-04-29T12:00:00.000000000Z | GBPUSD | ⠀──░░░░░░░░░░░░░░░░░░░░░░░░░──────────
 2026-04-29T12:00:00.000000000Z | EURUSD | ⠀⠀⠀⠀⠀──███████████████████████──────────
 2026-04-29T12:30:00.000000000Z | EURUSD | ───────░░░░░░░░░░░░░░░░░░░░░░░░░⠀⠀⠀⠀⠀⠀⠀⠀
 2026-04-29T12:30:00.000000000Z | GBPUSD | ───████────────────⠀⠀⠀⠀⠀⠀⠀⠀⠀⠀⠀⠀⠀⠀⠀⠀⠀⠀⠀⠀⠀
 2026-04-29T13:00:00.000000000Z | GBPUSD | ───██████─────────⠀⠀⠀⠀⠀⠀⠀⠀⠀⠀⠀⠀⠀⠀⠀⠀⠀⠀⠀⠀⠀⠀
Each symbol gets its own min/max scale via the lateral join, so candles are comparable within a symbol regardless of absolute price level.
Scalar variant
ohlc_bar(open, high, low, close, min, max [, width]) is a per-row scalar
function that takes precomputed OHLC values and explicit bounds, rendering one
candle per input row without aggregation.
When to use: OHLC values are already computed (from a subquery, materialized view, or external source) and you want to render them with precise control over the scaling bounds.
Parameters
open(double): opening price.high(double): highest price.low(double): lowest price.close(double): closing price.min(double): lower bound for scaling (left edge).max(double): upper bound for scaling (right edge).width(optional,int): bar width in characters, default 40.
Examples
SELECT timestamp,
       ohlc_bar(o, h, l, c, mn, mx, 50)
FROM (
  SELECT timestamp, o, h, l, c,
    min(l) OVER () mn,
    max(h) OVER () mx
  FROM (
    SELECT timestamp,
      first(price) o, max(price) h,
      min(price) l, last(price) c
    FROM fx_trades
    WHERE symbol = 'EURUSD'
      AND timestamp IN '$today'
    SAMPLE BY 30m
  )
)
LIMIT -5;
 timestamp                      | ohlc_bar
--------------------------------+----------------------------------------------------
 2026-04-29T11:00:00.000000000Z | ⠀⠀⠀──░░░░░░░░░░░░░░░░░░░░░░──────────────────────⠀
 2026-04-29T11:30:00.000000000Z | ⠀⠀────███─────────────────────────────────────────
 2026-04-29T12:00:00.000000000Z | ⠀⠀⠀⠀⠀⠀⠀──█████████████████████████████────────────
 2026-04-29T12:30:00.000000000Z | ────────░░░░░░░░░░░░░░░░░░░░░░░░░░░░░░░░░⠀⠀⠀⠀⠀⠀⠀⠀⠀
 2026-04-29T13:00:00.000000000Z | ────────│──────────⠀⠀⠀⠀⠀⠀⠀⠀⠀⠀⠀⠀⠀⠀⠀⠀⠀⠀⠀⠀⠀⠀⠀⠀⠀⠀⠀⠀⠀⠀⠀
NULL handling and validation
Aggregate variant:
- NULL price values are skipped. If all prices in a group are NULL, the result is NULL.
- If either min or max is NULL after reconciliation, the function throws an error.
- If
min > max, the function throws an error.
Scalar variant:
- If any OHLC parameter (open, high, low, close) is NULL, the result is NULL.
- If either min or max is NULL, the function throws an error.
- If
low > high, the function throws an error (catches invalid upstream data). - If
min > max, the function throws an error. - Validation order: NULL check first, then
low > high, thenmin > max.
See also
- bar - simpler single-value horizontal bar
- ohlc_bar_labels - same chart with labeled OHLC values
- Web console features - colorizing and rotation
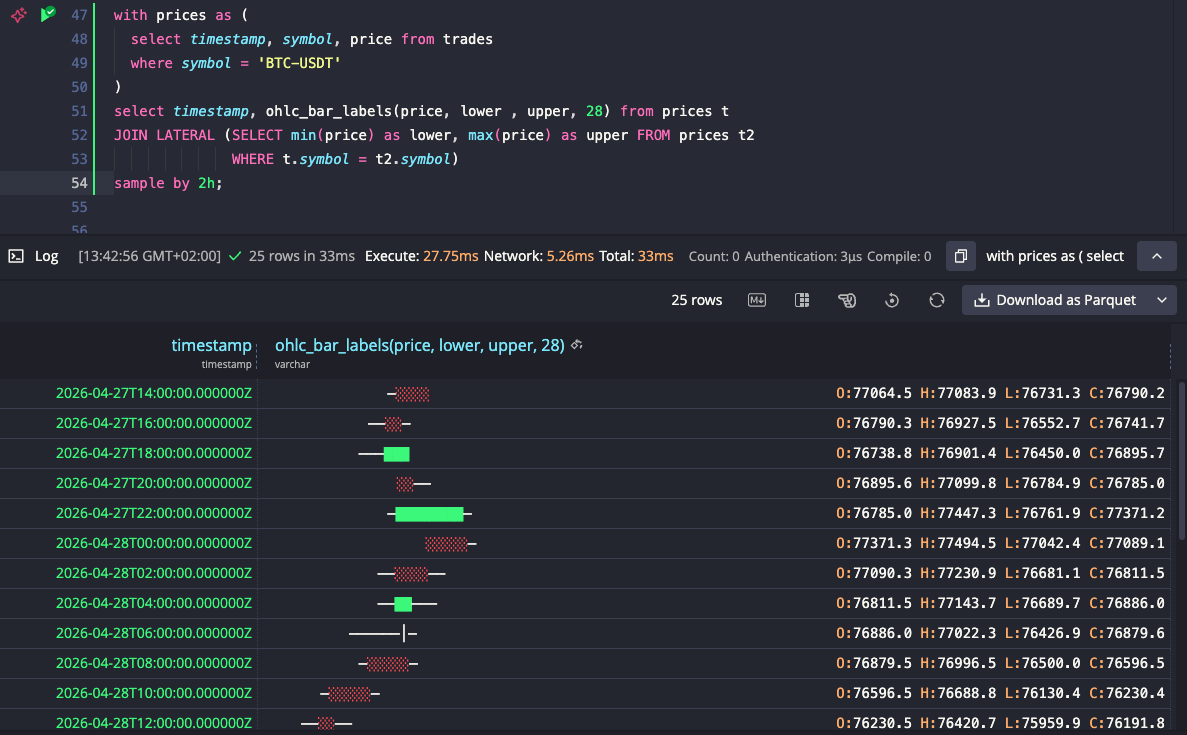
ohlc_bar_labels
Identical to ohlc_bar but appends O:<val> H:<val> L:<val> C:<val> after each candlestick bar. Available in both aggregate and scalar
forms:
ohlc_bar_labels(price, min, max [, width])- aggregateohlc_bar_labels(open, high, low, close, min, max [, width])- scalar
See ohlc_bar for parameters, bounds, FILL support, NULL handling, and additional examples.
Examples
SELECT timestamp, symbol,
       ohlc_bar_labels(price, lo, hi, 30)
FROM fx_trades t
JOIN LATERAL (
  SELECT min(price) lo, max(price) hi
  FROM fx_trades t2
  WHERE t.symbol = t2.symbol
    AND t2.timestamp IN '$today'
)
WHERE symbol IN ('EURUSD', 'GBPUSD')
  AND timestamp IN '$today'
SAMPLE BY 30m
LIMIT -5;
 timestamp                      | symbol | ohlc_bar_labels
--------------------------------+--------+------------------------------------------------------------------------------
 2026-04-29T12:00:00.000000000Z | GBPUSD | ⠀─░░░░░░░░░░░░░░░░░░░░░─────── O:1.3577 H:1.3651 L:1.3368 C:1.3378
 2026-04-29T12:00:00.000000000Z | EURUSD | ⠀⠀⠀⠀─██████████████████─────── O:1.162 H:1.1834 L:1.161 C:1.177
 2026-04-29T12:30:00.000000000Z | EURUSD | ─────░░░░░░░░░░░░░░░░░░░⠀⠀⠀⠀⠀⠀ O:1.1784 H:1.1784 L:1.1574 C:1.1618
 2026-04-29T12:30:00.000000000Z | GBPUSD | ──███─────────⠀⠀⠀⠀⠀⠀⠀⠀⠀⠀⠀⠀⠀⠀⠀⠀ O:1.3378 H:1.3493 L:1.3358 C:1.3403
 2026-04-29T13:00:00.000000000Z | GBPUSD | ──█████──────⠀⠀⠀⠀⠀⠀⠀⠀⠀⠀⠀⠀⠀⠀⠀⠀⠀ O:1.3382 H:1.3482 L:1.3358 C:1.3417
See also
- ohlc_bar - same chart without labels
- Web console features - colorizing and rotation
sparkline
sparkline(value) or sparkline(value, min, max, width) collects numeric
values within a group and renders them as a compact vertical block chart
(▃▅▇▆▄▂▁▃▅▇). Each value maps to one character. Best for showing trends,
cycles, and spikes.
Since sparkline is an aggregate, it pairs naturally with
SAMPLE BY to show intra-bucket trends.
The input can be any numeric type (double, int, long, short, float),
implicitly cast to double.
Parameters
valueis any numeric value. Each value produces one character in the output.min(optional,double): lower bound for scaling. PassNULLto auto-compute from data. Values belowminare clamped to the lowest character.max(optional,double): upper bound for scaling. PassNULLto auto-compute from data. Values abovemaxare clamped to the highest character.width(optional,int, constant): maximum number of output characters. When the group has more values thanwidth, the function sub-samples by dividing values into equal buckets and averaging each bucket. Must be a positive integer.
min and max can each independently be NULL, allowing partial auto-scaling.
For example, sparkline(price, 0, NULL, 24) fixes the floor at 0 but
auto-computes the ceiling from the data.
Return value
Return value type is varchar.
SELECT timestamp, symbol,
       round(avg(price), 0) avg_price,
       sparkline(price, NULL, NULL, 20)
FROM trades
WHERE symbol IN ('BTC-USDT', 'ETH-USDT')
  AND timestamp IN '$yesterday'
SAMPLE BY 1h
LIMIT -5;
 timestamp                   | symbol   | avg_price | sparkline
-----------------------------+----------+-----------+----------------------
 2026-04-28T21:00:00.000000Z | ETH-USDT |      2291 | ▆▇▆▅▄▃▃▄▃▃▂▃▃▃▃▁▂▁▃▃
 2026-04-28T22:00:00.000000Z | BTC-USDT |     76343 | ▅▆▅▆▇▇▆▅▅▄▄▄▄▄▄▃▂▂▁▁
 2026-04-28T22:00:00.000000Z | ETH-USDT |      2290 | ▅▅▅▆▆▇▆▄▄▄▄▄▃▃▂▂▂▁▁▁
 2026-04-28T23:00:00.000000Z | BTC-USDT |     76288 | ▂▂▂▁▁▂▄▅▆▄▅▄▄▃▄▅▅▅▆▆
 2026-04-28T23:00:00.000000Z | ETH-USDT |      2287 | ▃▂▂▃▄▅▅▆▅▄▃▃▃▃▄▄▆▆▆▇
The width of 20 sub-samples each hour's tick data into 20 characters,
regardless of how many ticks exist within each bucket.
Visual encoding
▁▂▃▄▅▆▇█
Characters range from ▁ (lowest) to █ (highest), giving 8 levels of
vertical resolution per character.
Null handling
NULLinput values are silently skipped.- If all values in a group are
NULL, the function returnsNULL. - An empty group (no rows) also returns
NULL. - When all values are identical (
minequalsmax), every character renders as█, signaling "no variation".
Examples
SELECT symbol, sparkline(price, NULL, NULL, 24)
FROM trades
WHERE timestamp IN '$yesterday'
SAMPLE BY 1h;
 symbol   | sparkline
----------+--------------------------
 ETH-USDT | ▃▂▃▂▂▃▄▄▄▃▂▁▁▁▁▃▅▅▇▇▆▅▆▅
 BTC-USDT | ▅▄▃▃▂▄▅▄▅▂▂▁▁▂▂▅▆▆▆▇▅▃▅▅
 LTC-USDT | ▄▃▄▅▅▆▆▄▅▃▂▂▂▁▂▂▃▄▃▃▂▂▁▁
 XLM-USDT | ▇▅▅▅▅▅▆▆▆▅▆▅▄▄▃▁▁▁▂▄▄▃▂▂
 SOL-USDT | ▆▅▄▅▅▆▅▅▅▅▄▄▄▃▃▃▃▄▅▆▇▇▆▆
SELECT symbol,
       sparkline(price, 0.5, 1.5, 24)
FROM fx_trades
WHERE symbol IN ('EURUSD', 'GBPUSD',
  'USDCHF', 'AUDUSD', 'USDCAD')
  AND timestamp IN '$today'
SAMPLE BY 1d;
 symbol | sparkline
--------+--------------------------
 AUDUSD | ▂▂▂▂▂▂▂▂▂▂▂▂▂▂▂▂▂▂▂▂▂▂▂▂
 USDCHF | ▃▃▃▃▃▃▃▃▂▃▃▃▃▂▂▃▃▃▃▂▂▂▂▂
 GBPUSD | ▆▆▆▆▆▆▆▆▆▆▇▇▆▆▆▆▆▆▆▆▆▆▆▆
 EURUSD | ▅▅▅▅▅▅▅▅▅▅▅▅▅▅▅▅▅▅▅▅▅▅▅▅
 USDCAD | ▇▇▇▆▆▆▇▇▇▇▇▇▇▇▇▇▇▇▆▇▇▇▇▇
All symbols share the 0.5-1.5 scale, so their relative price levels are directly comparable. USDCAD trades near the top, AUDUSD near the bottom.
SELECT timestamp,
       sparkline(price, 1.15, NULL, 24)
FROM fx_trades
WHERE symbol = 'EURUSD'
  AND timestamp IN '$today'
SAMPLE BY 30m
LIMIT -5;
 timestamp                      | sparkline
--------------------------------+--------------------------
 2026-04-29T11:00:00.000000000Z | ▅▅▅▅▆▆▅▆▇▆▆▆▇▇▆▆▆▅▅▅▄▄▃▃
 2026-04-29T11:30:00.000000000Z | ▃▃▄▄▄▅▅▅▆▇▇▇▇▅▅▆▆▅▅▅▅▃▃▃
 2026-04-29T12:00:00.000000000Z | ▃▄▄▅▄▄▅▆▆▆▇▇▇▅▅▆▆▆▆▆▆▆▇▇
 2026-04-29T12:30:00.000000000Z | ▆▄▄▃▃▄▄▅▅▄▃▃▃▃▄▅▅▅▆▅▆▅▄▃
 2026-04-29T13:00:00.000000000Z | ▅▅▄▄▅▆▅▄▄▅▅▄▆▆▆▆▅▅▄▅▄▅▅▅
Fixes the floor at 1.15 but auto-computes the ceiling from the data.
Clamping
When explicit min/max are provided, out-of-range values are clamped:
- A value below
minrenders as▁(clamped to floor) - A value above
maxrenders as█(clamped to ceiling) - Values are never silently dropped
Limitations
-
Sub-sampling averages buckets. When
widthis smaller than the number of collected values, the function divides values into equal buckets and averages each. This smooths spikes. If preserving peaks is important, use awidthequal to or greater than the expected number of values. -
Limited FILL support. When used with
SAMPLE BY,sparklinesupportsFILL(NULL),FILL(NONE), andFILL(PREV).FILL(LINEAR)andFILL(value)are not supported.
See also
- bar - Scalar horizontal bar
- Aggregate functions - Full aggregate reference
- SAMPLE BY - Time-series aggregation
Web console features
The QuestDB web console automatically detects visualization function output and enhances the display with coloring, monospace font rendering, and an interactive rotation feature.
Detection is automatic: the console checks that the SQL query text contains a visualization function call, then validates that the output column matches the expected Unicode signature.
Colorizing
The web console colorizes output from ohlc_bar, ohlc_bar_labels,
depth_chart, and depth_chart_labels. Coloring applies regardless of how many
columns the query returns.
OHLC coloring (ohlc_bar / ohlc_bar_labels):
- Bullish bodies (
█, close >= open) are displayed in green - Bearish bodies (
░, close < open) are displayed in red - Wick, doji, and padding characters remain in the default text color
- For
ohlc_bar_labels, the label prefixes (O:,H:,L:,C:) are displayed in orange
Market depth coloring (depth_chart / depth_chart_labels):
- Bid side (characters before the spread separator
╎) is displayed in green - Ask side (characters after the spread separator) is displayed in red
- The spread separator itself remains in the default text color
- For
depth_chart_labels, the label prefixes (bb:,ba:,tb:,ta:) are displayed in orange

bar and sparkline output is not colorized.
Rotating to vertical chart
The web console can rotate bar and ohlc_bar / ohlc_bar_labels output into
a vertical chart view. This feature is available when all of these conditions are
met:
- The query result has exactly two columns
- One column is TIMESTAMP or TIMESTAMP_NS
- The other column is VARCHAR containing
barorohlc_baroutput
When these conditions are met, a rotate icon
(![]() ) appears at the right
side of the VARCHAR column header. Clicking it toggles between:
) appears at the right
side of the VARCHAR column header. Clicking it toggles between:
- Normal (horizontal) view: the default grid layout. Rows are listed vertically with bars rendered horizontally.
- Rotated (vertical) view: a transposed layout where time flows left-to-right along a horizontal scroll axis, and bars are rendered vertically, resembling a traditional candlestick or bar chart. Timestamps appear at the bottom of each column (time in green, date in gray). The rotate icon turns cyan when the rotated view is active.
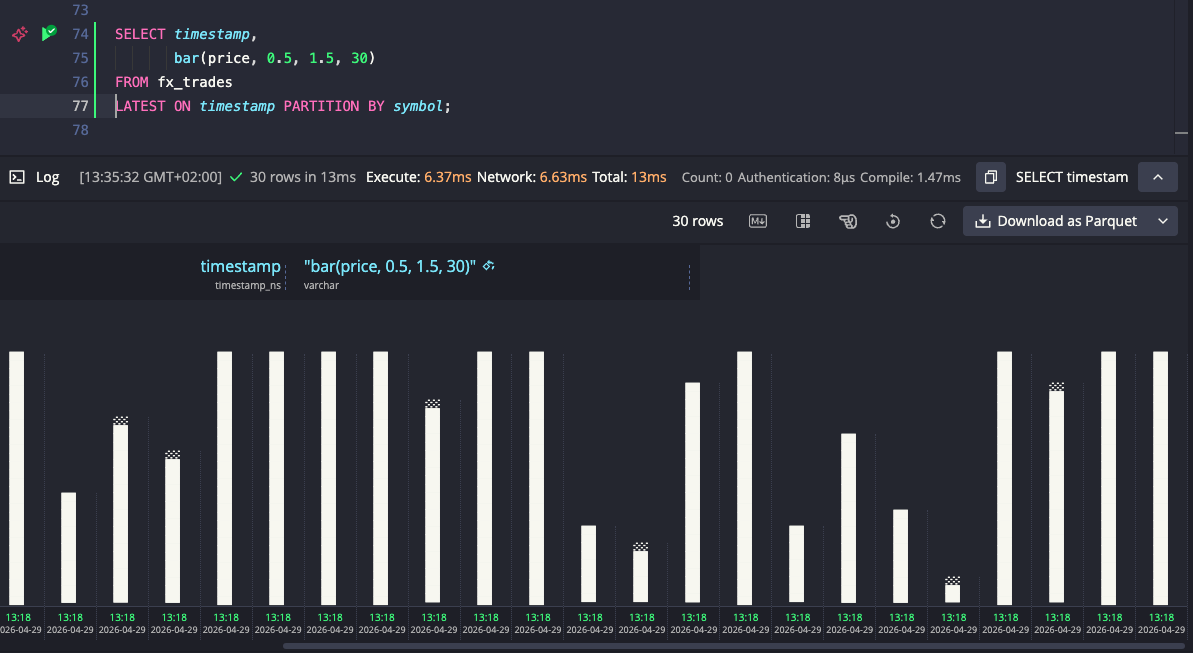
In rotated view, bar() fractional block characters are replaced because
partial-width characters do not render correctly when the text flow is vertical.
Fractional blocks that are half or more (▉▊▋▌) become a full block (█),
while smaller fractions (▍▎▏) become a faded tip (░).
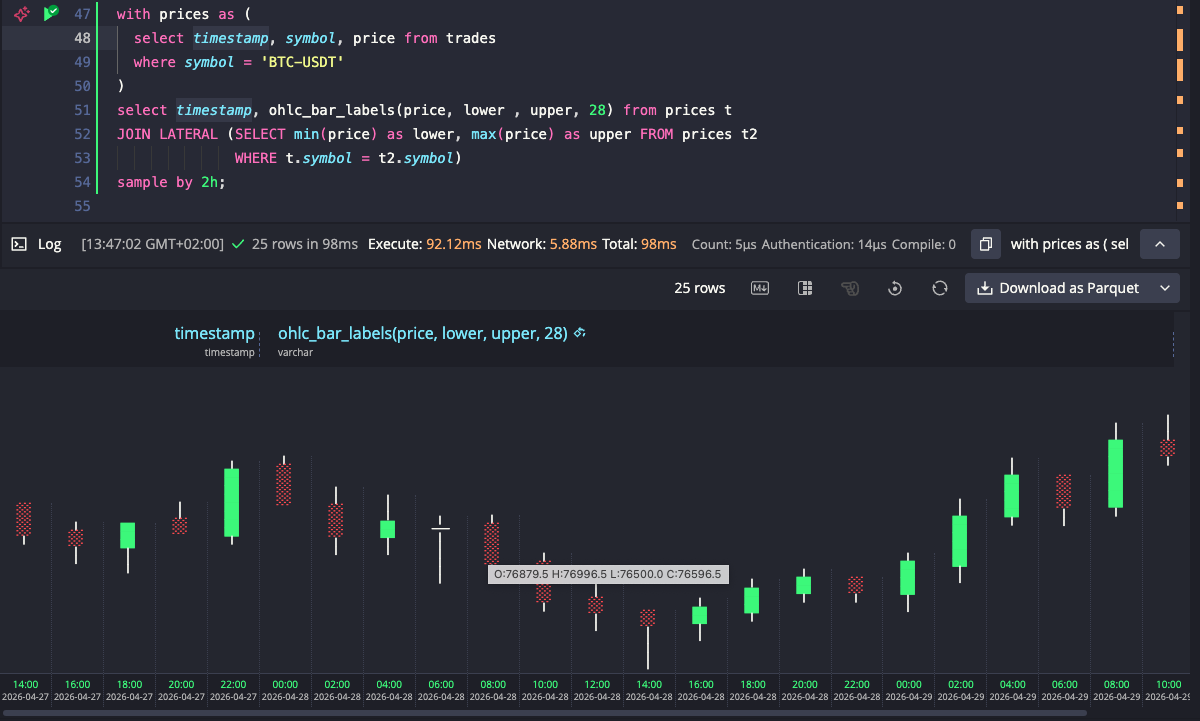
For ohlc_bar_labels, labels appear inline in the normal horizontal view
but are stripped in rotated view and shown as a tooltip when hovering over a
candle column. OHLC green/red coloring is preserved in both views.
The rotation state persists across consecutive queries that produce rotatable results. If you run a query that does not meet the rotation conditions (different functions, extra columns, or no visualization function), the state resets.
depth_chart and sparkline do not support rotation.
Configuration
All visualization functions enforce a maximum output size controlled by an existing server property:
# server.conf
cairo.sql.string.function.buffer.max.size=1048576
Default is 1,048,576 bytes (1 MB). This is the same property used by
string_agg(), lpad(), and rpad().
Each output character is 3 bytes in UTF-8, so the default allows up to 349,525
characters of output. For sparkline, this limits the number of values
accumulated per group. For bar and ohlc_bar, this limits the width
parameter. For depth_chart, this limits the total chart width (bid levels +
spread + ask levels). If the limit is exceeded, the function throws a
non-critical error.
In practice these limits are generous. A sparkline or bar of 349K characters would be unusable. The limit exists to prevent accidental memory exhaustion.